PropNex Picks
|September 17,2025Resale Condo Market Watch in August 2025
Share this article:
Healthy resale condo activity in August amid robust new launch activity
Sales momentum in the overall property market remained steady in August, including the resale condo market. About 962 condo units worth $1.9 billion was resold during the month - compared with the 1,026 resale transactions valued at nearly $2 billion transacted in July.
The resale home market demand remained robust during the month amidst the flurry of new launches. Momentum in the resale market could take a pause towards the second half of August and first half of September due to the seasonal lull during the Hungry Ghost Month. In August, new sales accounted for nearly 68% of non-landed transactions, while resale deals accounted for nearly half of transactions (30.4%, see Chart 1).
Chart 1: Proportion of private non-landed transactions (excl. EC) by sale type by month
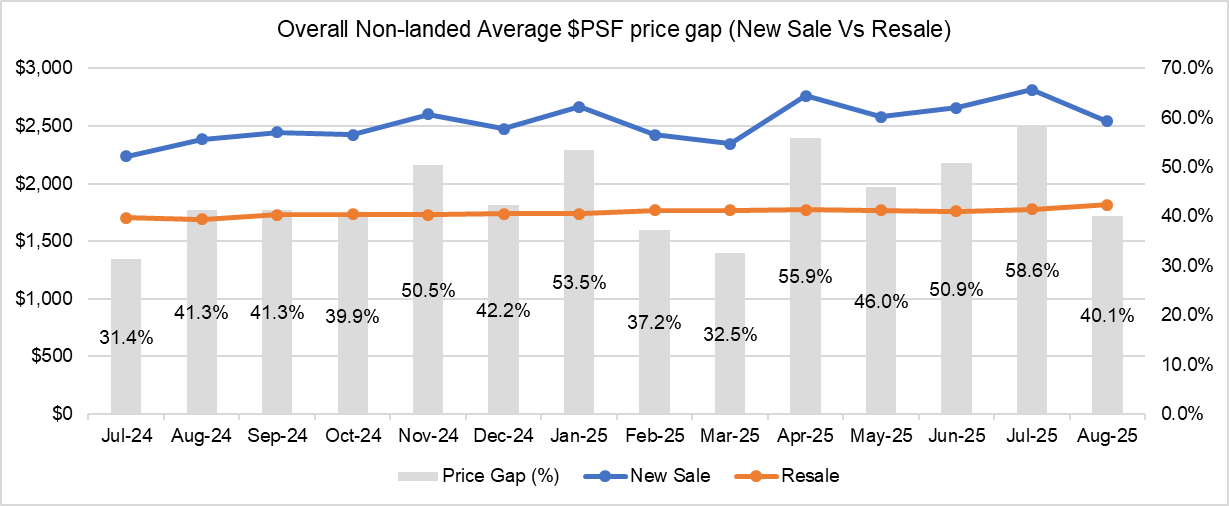
Despite the surge in new launch activity during the month, the average unit price of new non-landed homes dipped. The average new sales price fell by 9.7% month-on-month (MOM) to $2,542 psf in August, while the average resale unit price grew marginally by 2.2% MOM. As such, the new sale and resale price gap dipped to a 5-month low of 40% in August (see Chart 2), the lowest since March 2025 when the new sale-resale price gap reached 32.5%.
Chart 2: New sale and Resale Price gap of non-landed homes (overall) by month
Uptick in profitability and winners
In terms of profitability, resale condo units transacted in August saw a pickup in gains compared with the previous month. Analysing the profits reaped by resale non-landed private homes in July and August 2025, it was found that resale condo deals garnered higher profits. The proportion of loss-making transactions dipped in August 2025 over the previous month. The resale profit analysis involves computing gains achieved for the units by matching the condo resale transactions in July against their respective previous purchase price, according to caveats lodged.
The study showed that 14% of resale condo transactions (126 deals) in August made more than $1 million in profits, a similar proportion to July (13.3%). Of these million-dollar profit-making deals, the deals are evenly distributed amongst the three market segments, 35.7% each in the city fringe or Rest of Central Region (RCR) homes and Outside Central Region (OCR), followed by the Core Central Region (CCR) (28.6%) homes. Loss-making deals in August accounted for 4.7% of transactions, down from 5.8% in July (see Chart 3).
Chart 3: Proportion of profit quantum of resale non-landed transactions (July 2025 vs August 2025)
The average profit was subsequently computed on a project basis. To minimise sampling errors, resale condominium projects that posted fewer than three transactions during the month are excluded from the study. Based on URA Realis caveat data analysed by PropNex Research, the most profitable condo in the CCR, was D'Leedon in District 10, which pulled in an average profit of $537,000 across five transactions in August.
In the RCR, the most profitable condo development in August was Maple Woods, a project located in District 21, which achieved an average profit of $1.85 million, across four transactions. Maple Woods was also the overall best performing project in terms of average profit quantum in August. In the heartlands or Outside Central Region (OCR), the most profitable project was Varsity Park Condominium in District 5 which garnered an average profit of $1.28 million across three transactions.
Top Resale Condo projects^ in terms of average gross profit* by region (August 2025)
Project Name | No. of transactions | Average Profit Gained ($) | Average Annualized Profit (%)# | Year completed | District |
CCR | |||||
| D'LEEDON | 5 | $537,008 | 2.5% | 2014 | 10 |
| FOURTH AVENUE RESIDENCES | 3 | $298,000 | 2.3% | 2022 | 10 |
| LEONIE SUITES | 3 | $266,667 | 1.8% | 2006 | 9 |
RCR | |||||
| MAPLE WOODS | 4 | $1,847,663 | 4.6% | 1997 | 21 |
| THE SEA VIEW | 3 | $1,333,085 | 7.8% | 2008 | 15 |
| THE CASCADIA | 5 | $826,136 | 3.9% | 2010 | 21 |
OCR | |||||
| VARSITY PARK CONDOMINIUM | 3 | $1,284,758 | 5.2% | 2008 | 5 |
| CLEMENTI PARK | 4 | $1,110,000 | 6.6% | 1986 | 21 |
| FLAMINGO VALLEY | 3 | $779,852 | 3.2% | 2014 | 15 |
*Gains are derived from the resale transaction for each unit against the unit's last caveated transaction; the average profit is determined on the profits of all resale transactions in the development which occurred during the month. The profit reflected is gross - it has not accounted for the applicable seller's stamp duties, interest payable, taxes and other relevant divestment costs.
#Annualised Gains is the compounded annual rate of return which shows the rate of return over the time period between the point of resale and the property's last caveated transaction, expressed in annual percentage terms. The formula for determining this is simply: [(current resale price) / (purchase price)] time period in years-1Analysis was done based on available data from URA Realis
Going by districts, resale homes in District 10 (Holland, Bukit Timah) raked in the highest profits on quantum basis, with transactions reaping average gains of nearly $990,000 per deal. In terms of annualised gains, resale homes in District 28 (Seletar, Yio Chu Kang) enjoyed an average annualised profit of 5.3% per deal.
Top 10 Resale Condo districts^ in terms of average gross profit* (August 2025)
District | No. of transactions** | Average Gains ($) | Average Annualised Gains (%)# |
D10 | 48 | $989,987 | 2.7% |
D11 | 24 | $820,474 | 3.1% |
D21 | 39 | $815,316 | 4.2% |
D15 | 73 | $787,231 | 4.3% |
D20 | 32 | $658,109 | 5.2% |
D22 | 16 | $638,646 | 4.9% |
D16 | 59 | $529,731 | 3.8% |
D5 | 61 | $516,404 | 4.2% |
D12 | 32 | $504,814 | 3.8% |
D23 | 52 | $487,780 | 4.2% |
^Districts with fewer than 10 transactions during the month were excluded from this analysis
*Gains are derived from the resale transaction for each unit against the unit's last caveated transaction; the average profit is determined on the profits of all resale transactions in the development which occurred during the month. The profit reflected is gross - it has not accounted for the applicable seller's stamp duties, interest payable, taxes and other relevant divestment costs.
#Annualised Gains is the compounded annual rate of return which shows the rate of return over the time period between the point of resale and the property's last caveated transaction, expressed in annual percentage terms. The formula for determining this is simply: [(current resale price) / (purchase price)] time period in years-1Analysis was done based on available data from URA Realis
**Resale units with no available last caveated transaction data are excluded from this analysis
Analysing individual transactions by gross profit quantum, it was found that the top five gainers from each region ranged from $1.76 million to $5.1 million. The units which chalked up bigger gains were mostly sizeable large format condos that are more than 1,200 sq ft in size, and consisted mostly of older projects built in the 1980s to early 2000s. The respective holding periods for the most profitable resale properties were mostly beyond 15 years - the oldest being a unit held for 30 years.
Top 5 Resale Condo transactions in August 2025 by gross profit by region
*Gains are derived from the resale transaction for each unit against the unit's last caveated transaction; the average profit is determined on the profits of all resale transactions in the development which occurred during the month. The profit reflected is gross - it has not accounted for the applicable seller's stamp duties, interest payable, taxes and other relevant divestment costs.
#Annualised Gains is the compounded annual rate of return which shows the rate of return over the time period between the point of resale and the property's last caveated transaction, expressed in annual percentage terms. The formula for determining this is simply: [(current resale price) / (purchase price)] time period in years-1Analysis was done based on available data from URA Realis
**Resale units with no available last caveated transaction data are excluded from this analysis
It was found that the overall most profitable transaction and top gainer in the CCR was for a 19th floor unit at Horizon Towers. It was resold for an estimated profit of $5.1 million, reflecting an annualised profit of 7.1%. Based on URA Realis caveat data, the 5,145-sq ft unit was first bought in February 2004 and subsequently resold for $6.6 million in August 2025, with a holding period of 21 years. The 99-year leasehold project in River Valley was built in 1984. The project is situated within walking distance of Great World MRT station on the Thomson East-Coast Line (TEL).
The top gainer in the RCR in terms of gross profit was for unit transacted at Maple Woods in District 21, which fetched a gross profit of $2.76 million (annualised profit of 3.9%), based on caveats lodged. The 1,787-sq ft 2nd floor unit was sold for $4.06 million, with a holding period of 30 years. The freehold project in Bukit Timah was built in 1997, and it is near to the King Albert Park MRT station on the Downtown Line.
Over in the OCR, the top gainer in August was a 5th floor unit located in Elliot At The East Coast in District 15. The 2,831-sq ft unit was sold for $5.03 million, achieving an estimated profit of $2.8 million - which reflects an annualised profit of 5.3% over a holding period of about 20 years. The freehold project was built in 1984 and situated at the doorstep of Siglap MRT station on the Thomson East-Coast Line (TEL).
With rising new launch prices, condo resellers may stand to benefit as some homebuyers may find themselves priced out of the new launch market and could consider options in the resale segment. That said, resale gains may potentially see some moderation, particularly amidst the economic volatilities and uncertainties around how interest rates will move in the near-term.